
Every second broker in Hyderabad says it’s written into the constitution: “Sir/Madam; this area gives minimum 10% appreciation every year, guaranteed.” Say it with enough confidence, apparently, and it becomes a fact.
Except real estate doesn’t work on vibes. It works on registrations, transactions, data and when you go looking for that data, the “magic 10%” turns out to be a lot more complicated (and more interesting) than any brochure will admit.
Let’s fact-check the number Hyderabad’s real estate industry loves the most.
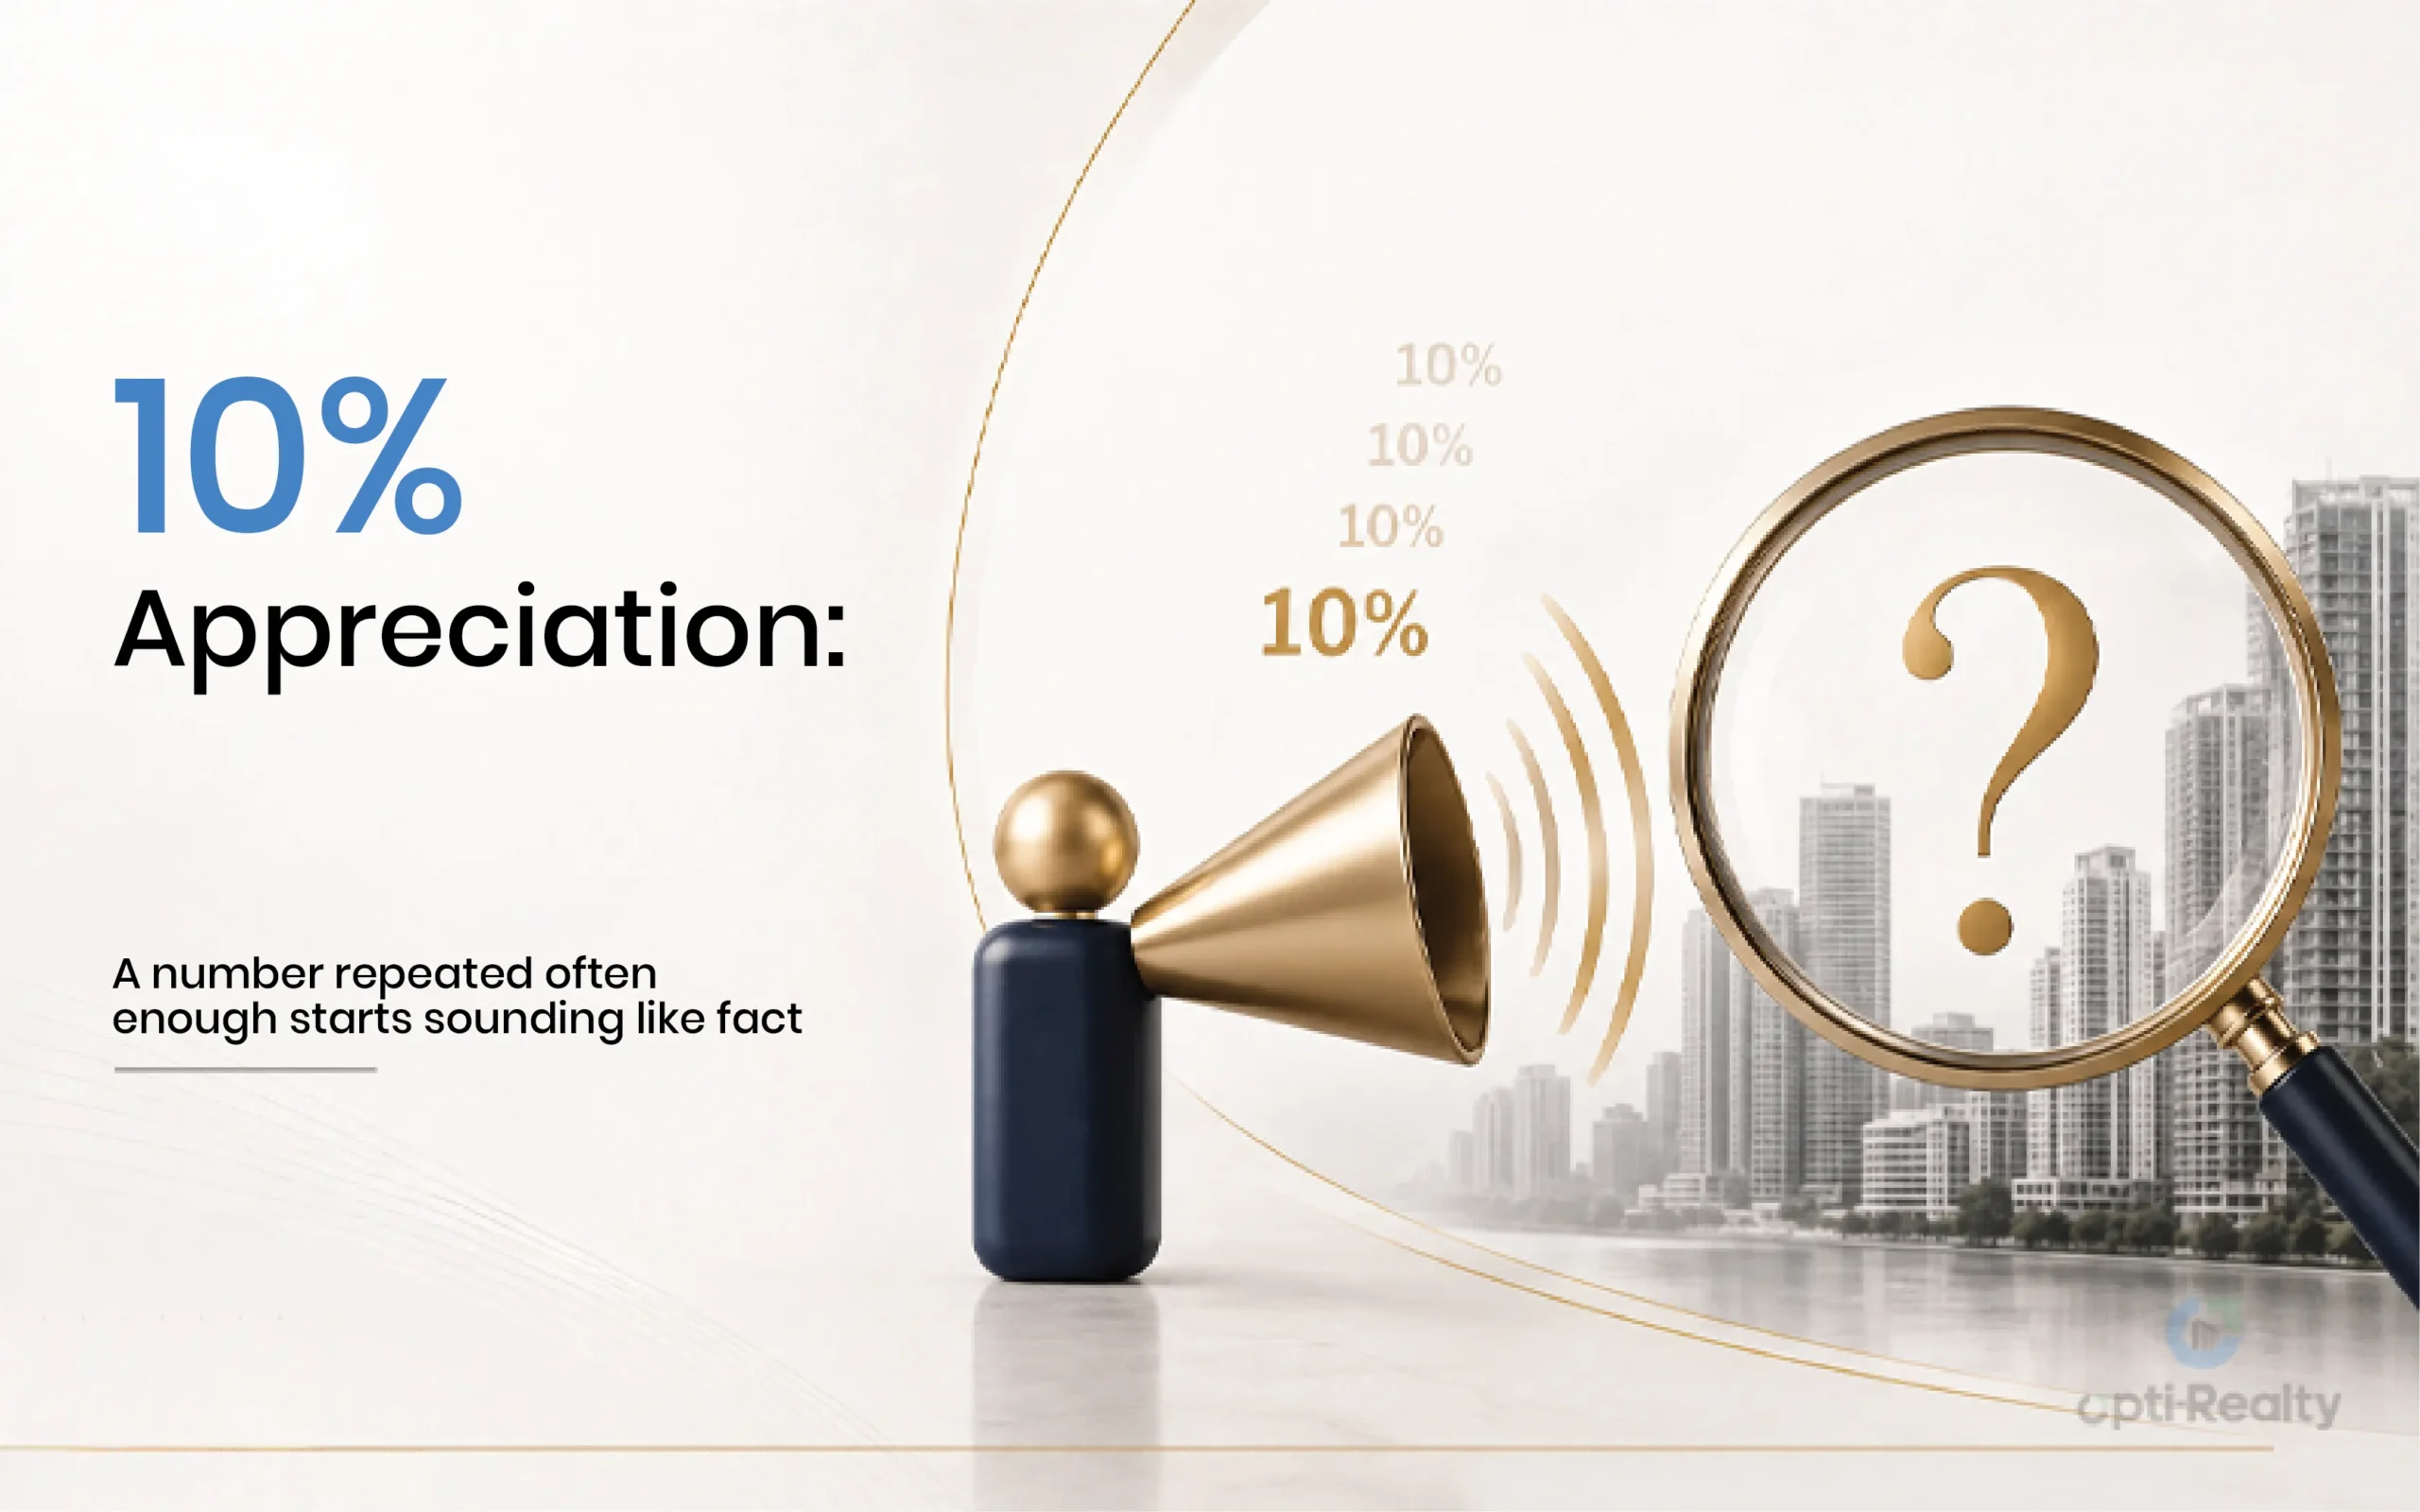
A number repeated often enough starts sounding like fact
Where Did the 10% Number Even Come From?
It is not something conjured up totally. City property consultants Cushman & Wakefield reported a decade ago that the capital value was increasing back then in Hyderabad with 14% appreciation in the middle-class segment and 16% in the upper class in the span of three years. These figures were true when they were presented by reputed institutions. There has evidently been a gap between this report and now so the number “14-16% appreciating every three years” turned into “10% appreciating every year indefinitely.”
That’s the brochure fiction part. A real number from a real study became a permanent marketing slogan, detached from the specific years, segments and localities described.
What the Data Actually Says Right Now
Here’s where it gets genuinely useful. Recent market reports paint a far more textured picture than any single percentage:
- Hyderabad’s residential prices rose roughly 8% year-on-year in Q1 2026, according to JLL’s Residential Dynamics report solid, but not the flat “10%” everyone quotes.
- A few quarters earlier, in Q3 2025, the city’s residential prices had climbed a sharper 13%, per Sattva Group’s market forecast showing how much the number moves between quarters, let alone years.
- Meanwhile, aggregator data from Square Yards shows prices holding almost flat, up just 0.18% quarter-on-quarter as of June 2026. After an earlier jump from ₹8,600 to ₹9,300 per sq ft as a sign, the market was consolidating, not sprinting.
- Rental yields across the city currently average around 4.26%, a number that matters just as much as appreciation for anyone calculating real returns.
There are four credible sources and four “true” numbers based on measuring different time periods, segments and slices of the same location. That’s why taking a flat “10%” statement at face value would require you to question it and think of the basis on which this percentage was calculated.
The Locality Lottery: Averages Hide the Real Story
City-wide statistics are mostly unreliable when it comes to individual buying decisions, as growth in Hyderabad is anything but uniform. For instance, fringe areas like Turkapally and Shamshabad have seen a three-year appreciation of over 160%, thanks to their low starting point and catching up with the infrastructure development. Meanwhile, already established locations like Kokapet, Gachibowli and Tellapur are in the ₹9,000-15,000 per sq ft range, meaning growth is real but slower in percentage terms due to the high base price.
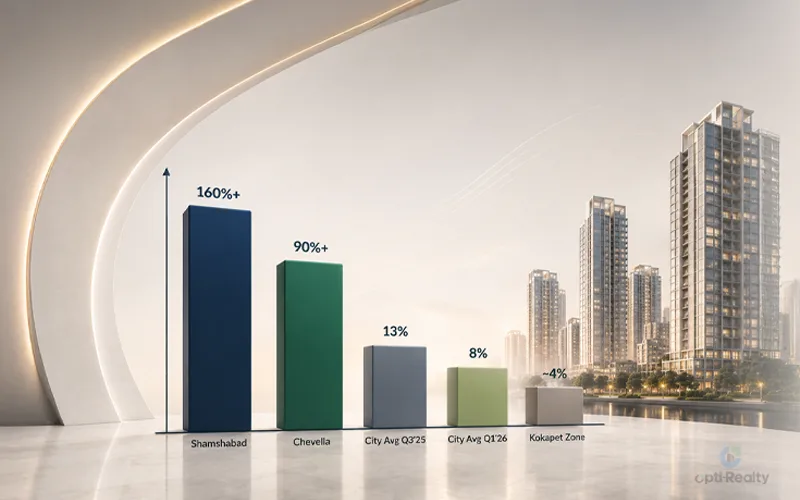
One city average, five very different real stories
Even within the luxury segment, the status of the Market has changed again. Homes that are priced above ₹ 1 crore have seen an increase in demand and sales volumes that stand at 73%, thereby indicating a clear picture of demand and not price appreciation.
How to Fact-Check an Appreciation Claim Yourself
Before you believe any percentage on a brochure, run it through a quick reality check:
- Ask “over what period?” A number without a timeframe is marketing, not math.
- Check the locality, not the city. City-wide averages can hide a 3% zone sitting right next to a 15% one.
- Look at registrations, not listings. Asking prices to inflate faster than actual sale prices always verify against registered transaction data where possible.
- Separate demand from appreciation. More people buying luxury homes isn’t the same as prices actually rising.
- Cross-check with RERA data and multiple market reports, not just the builder’s own marketing material.
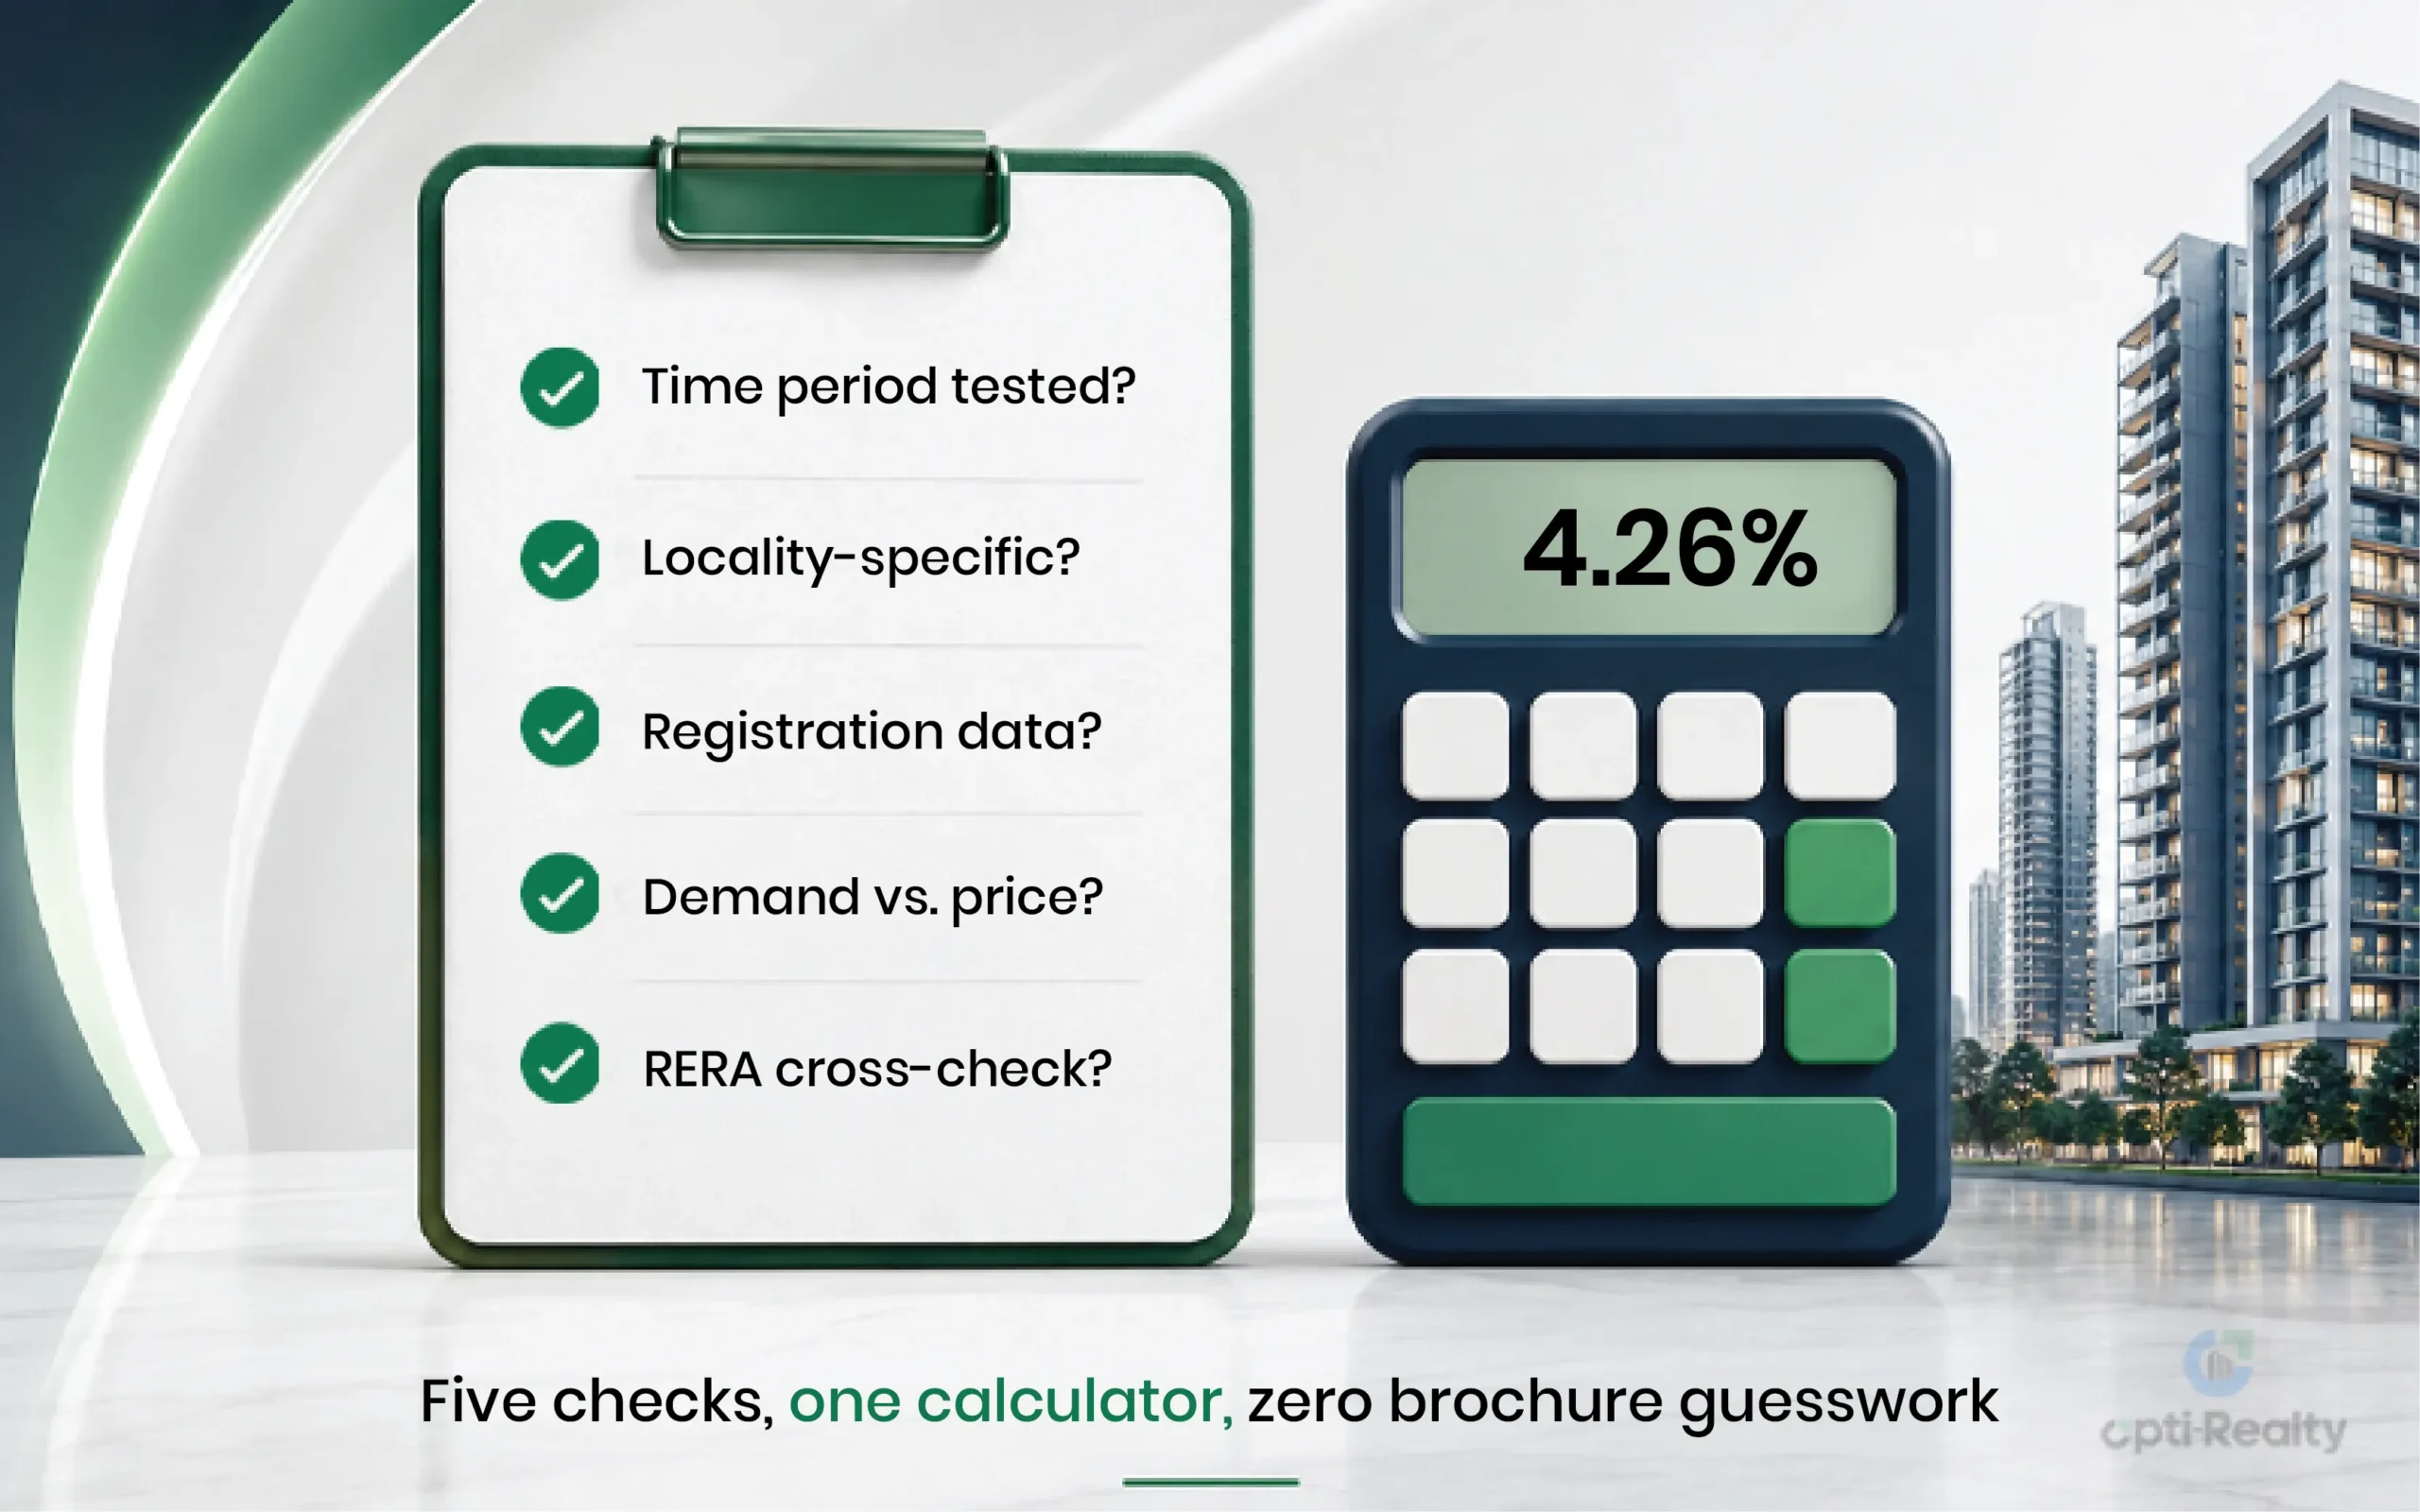
Five checks, one calculator, zero brochure guesswork
The Bottom Line
Is 10% appreciation gospel truth? Sometimes, in the right locality, in the right cycle, yes and sometimes it’s even higher. Is it a guarantee that every brochure is in the city, regardless of location or timing? Absolutely not. The honest answer is “it depends,” which admittedly doesn’t fit as neatly on a hoarding.
This is exactly the kind of number-crunching Opti-Realty does before any project makes it onto our listings. Every property we feature comes bank-verified, cross-checked against real market data, and mapped against actual locality performance, not just whatever growth percentage sounded good in a sales meeting. Want to know what a property is likely to appreciate, rather than what a brochure hopes you’ll believe? Run it through the Opti-Realty ROI calculator before you sign anything.